NewProduct update

Analytics, rebuilt.

Analytics in Tacklit has been rebuilt from the ground up. Built-in dashboards on your live data, a dashboard builder, a table builder and a data agent that answers questions in plain language. It's live in your workspace now.

New to Tacklit? Book a demo and we'll show you around.

Inside the new Analytics

From ready-made dashboards to plain-language answers

Built in

Dashboards for the questions you already ask

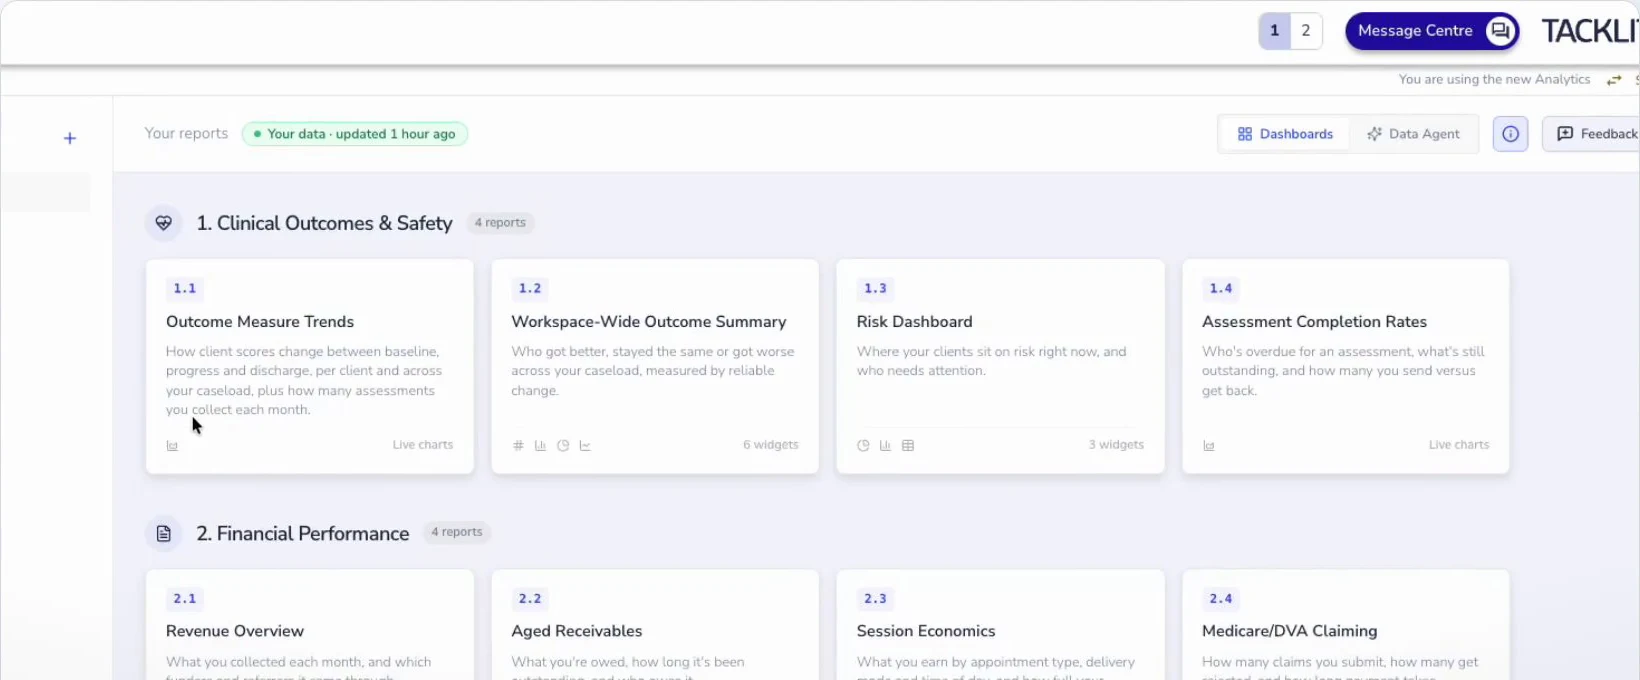
Seventeen ready-made reports, grouped the way you run your service, running on your live data from day one. No setup and no spreadsheet exports.

  • Clinical outcomes and safety: outcome measure trends, a workspace-wide outcome summary, a risk dashboard and assessment completion rates
  • Financial performance: revenue overview, aged receivables, session economics and Medicare/DVA claiming
  • Operations and compliance reporting alongside
  • A live data badge shows when your data was last updated
New Tacklit Analytics showing built-in report groups: Clinical Outcomes and Safety with Outcome Measure Trends and Workspace-Wide Outcome Summary, and Financial Performance with Revenue Overview and Aged Receivables
Built-in reports, grouped by the questions you ask most.

Dashboard builder

Tables, charts, KPIs. Built your way.

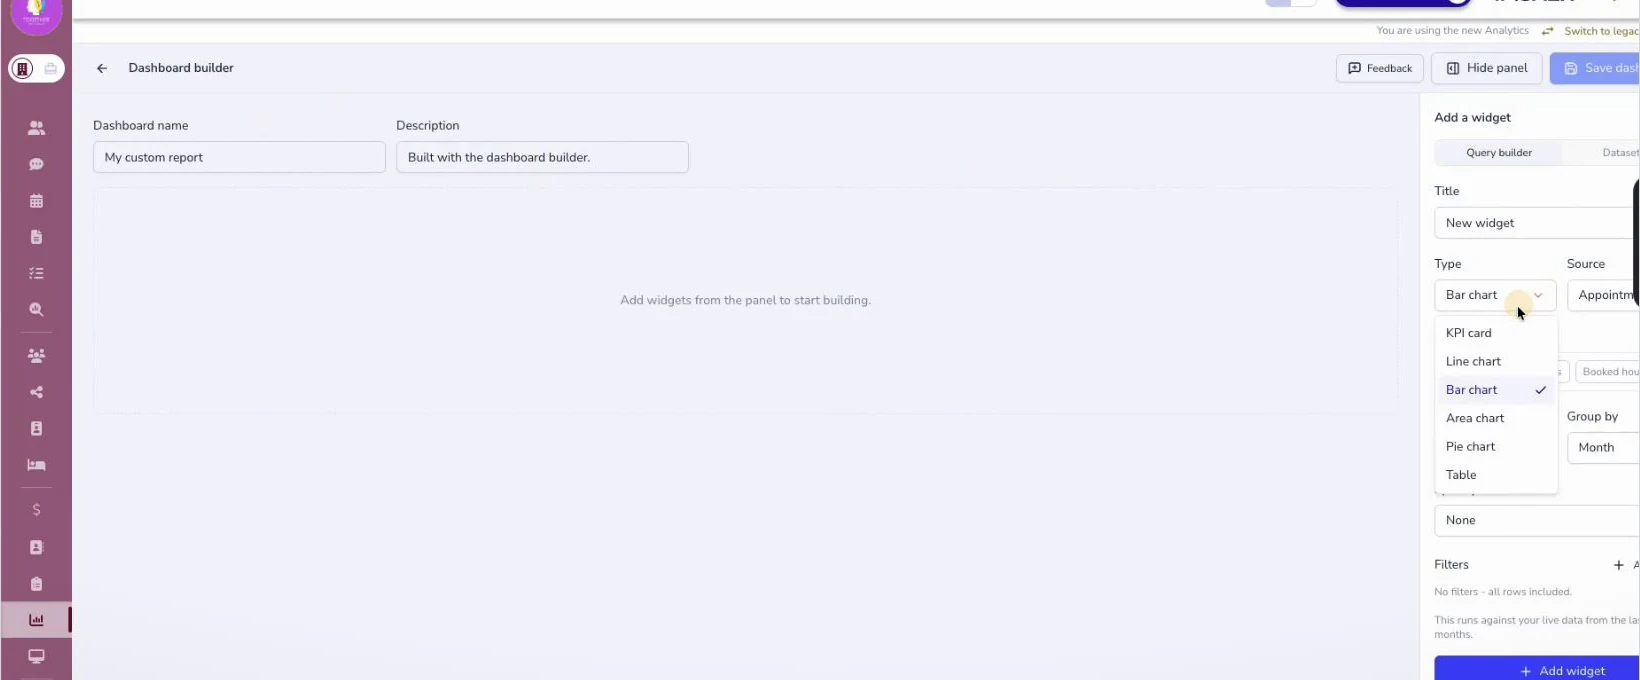
When the built-in views aren't quite the question, make your own. Add widgets, choose the source and grouping, and save the dashboard for your team.

  • Six widget types: KPI card, line, bar, area and pie charts, and tables
  • Choose the data source, then group by period, such as month
  • Add filters to focus each widget
  • Name the dashboard, describe it and save it for your team
  • KPI card
  • Line chart
  • Bar chart
  • Area chart
  • Pie chart
  • Table
Tacklit dashboard builder with the Add a widget panel open, showing widget types KPI card, line chart, bar chart, area chart, pie chart and table, with source and group by options
Add a widget, pick its type and source, and save it for the team.

Table builder

Your data, down to the row

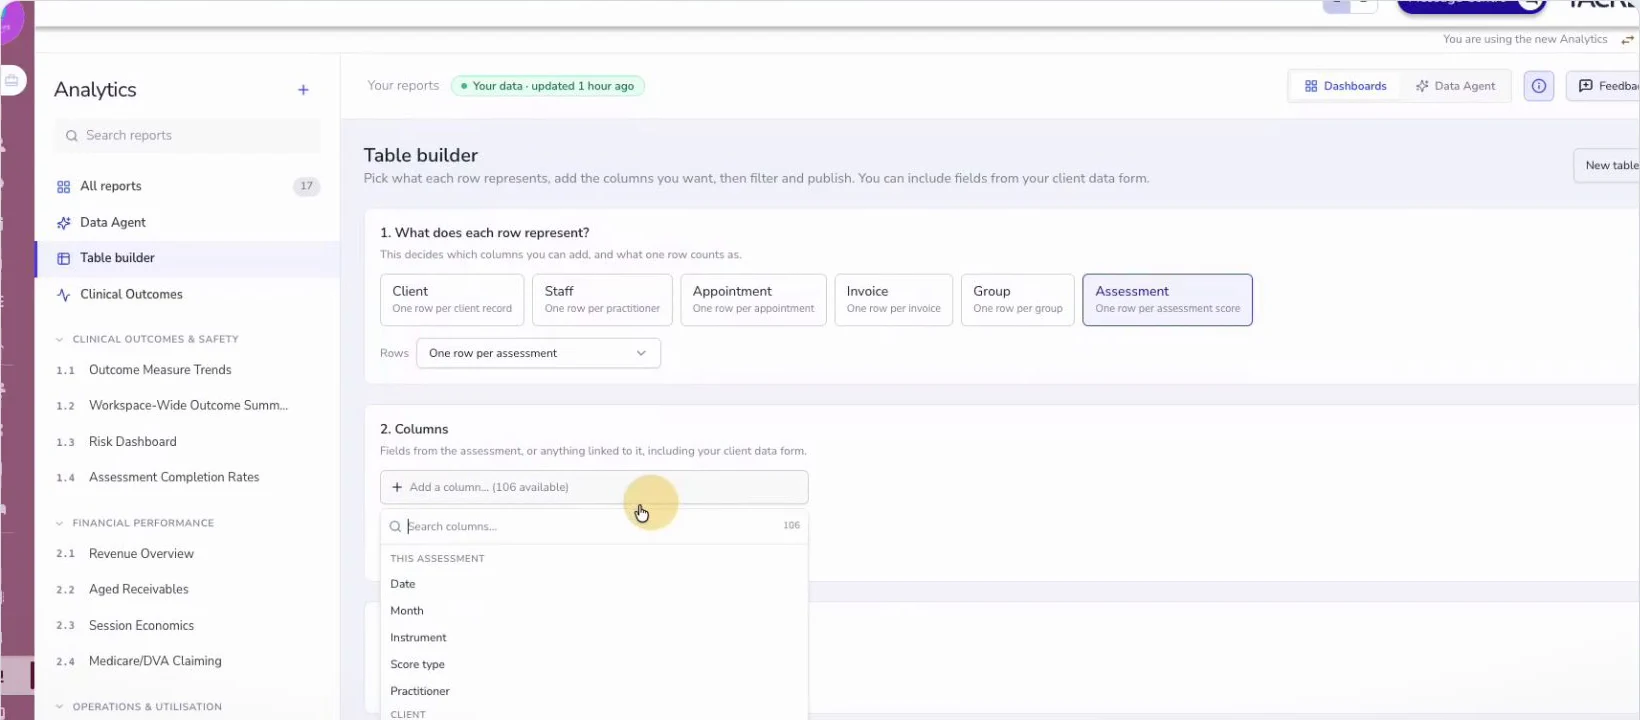
Need the detail behind a number? Decide what each row represents, add the columns you want, filter, run and export.

  • Start with what each row represents: a client, staff member, appointment, invoice, group or assessment
  • Search and add the columns you need
  • Filter to exactly the records you're after
  • Run it, then export it
  • Client
  • Staff
  • Appointment
  • Invoice
  • Group
  • Assessment
Tacklit table builder asking what each row represents, with options Client, Staff, Appointment, Invoice, Group and Assessment, and a searchable column picker
Pick the row type, add columns from a searchable list, then run and export.

Data agent

Ask a question. Get the answer.

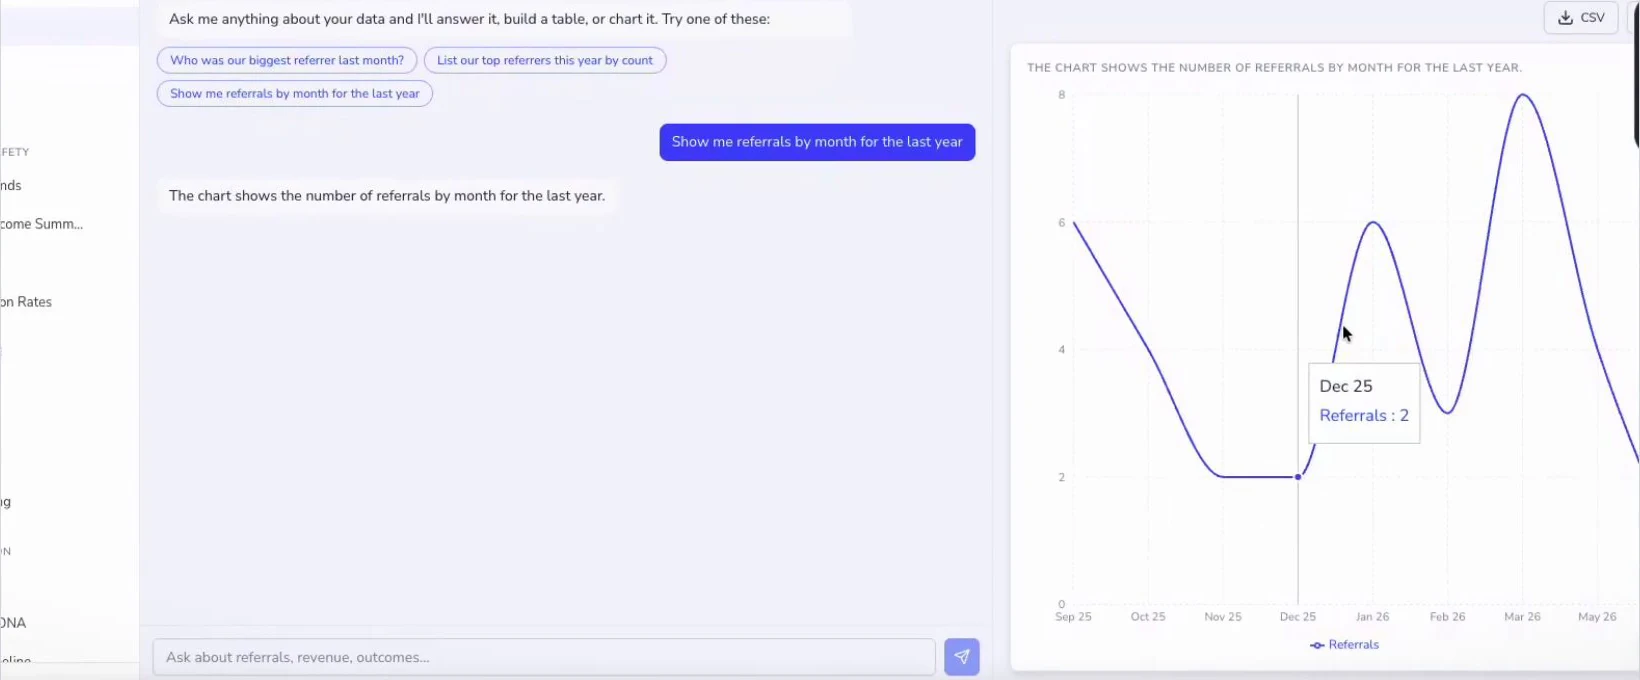
Type a question the way you'd ask a colleague. The data agent looks over your data and comes back with a table or a chart.

  • Ask in plain language, no report building required
  • Answers come back as a table or a chart
  • Suggested questions to get you started
  • Download chart data as CSV
  • Who was our biggest referrer last month?
  • List our top referrers this year by count
  • Show me referrals by month for the last year
Tacklit data agent answering 'Show me referrals by month for the last year' with a line chart of referrals by month
“Show me referrals by month for the last year”, answered as a chart.

For existing customers

Nothing you use today goes away

Legacy Analytics is still there. Switch between the new Analytics and Legacy at any time, so you can explore at your own pace without losing the reports your team relies on.

  • Legacy reports stay available
  • Switch between the two any time
  • No setup needed

Get started

Go and have a look

Whether you've used Tacklit for years or you're seeing it for the first time.

Already using Tacklit?

Live in your workspace now

  1. Open AnalyticsIt's live in your workspace now.
  2. Start with the built-in dashboardsOutcomes, safety, finance and operations are already running on your live data.
  3. Make it yoursBuild a dashboard from tables, charts and KPIs, then save it for your team.
  4. Get the detailUse the table builder to pull exact rows, filter them and export.
  5. Ask the data agentType a question in plain language and get a table or chart back.
  6. Tell us what you thinkUse the Feedback button in Analytics to share what works and what you'd like next.

New to Tacklit?

Reporting that's part of the practice, not a separate project

Analytics runs on the same live data as your clients, appointments, invoices and assessments, so the answers are there when you need them.

  • Outcome, safety and finance dashboards from day one
  • Your own dashboards and tables, shared with the team
  • Answers to plain-language questions

Questions

Frequently asked questions

What's changed in Tacklit Analytics?

Analytics has been rebuilt from the ground up. It now includes built-in dashboards for outcome measures, safety, financial performance and operations; a dashboard builder with tables, charts and KPIs; a table builder for row-level data you can filter and export; and a data agent that answers questions in plain language.

Is Legacy Analytics going away?

No. Nothing you use today goes away. Legacy Analytics is still there, and you can switch between New Analytics and Legacy at any time.

Do I need to set anything up?

No. The built-in dashboards are ready to go and run on your live data as soon as you open Analytics.

Which dashboards are included?

Seventeen built-in reports, including outcome measure trends, a workspace-wide outcome summary, a risk dashboard, assessment completion rates, revenue overview, aged receivables, session economics and Medicare/DVA claiming, plus operations and compliance reporting.

Can I build my own dashboards and share them?

Yes. The dashboard builder lets you add KPI cards, line, bar, area and pie charts and tables, choose the data source and grouping, and save the dashboard for your team.

Can I export data?

Yes. The table builder lets you choose what each row represents, add columns and filters, run the table and export it. Data agent charts can also be downloaded as CSV.

What is the data agent?

The data agent lets you ask a question about your data in plain language, such as “Show me referrals by month for the last year”. It looks over your data and comes back with a table or a chart.

How do I give feedback?

Use the Feedback button in Analytics to tell us what you think.

Read the video transcript

Analytics in Tacklit has been rebuilt from the ground up. Everything you're about to see is new. It starts with built-in dashboards: outcome measures, safety, financial performance, operations, ready to go, running on your live data. Then make it yours. Build your own dashboards with tables, charts and KPIs, and save them for your team. Need the detail? The table builder pulls the exact rows you want. Pick your columns, add filters, run it, export it. And there's a data agent. Ask a question in plain language. It looks over your data and comes back with a table or a chart. Nothing you use today goes away. Legacy Analytics is still there, and you can switch between the two any time. Go and have a look, and tell us what you think with the feedback button.

Go and have a look. Then tell us what you think.

The new Analytics is live in your workspace now. Use the Feedback button in Analytics to tell us what's working and what you'd like next.

St Kilda, Melbourne

We acknowledge the Aboriginal and Torres Strait Islander peoples as the first inhabitants of this nation and the traditional custodians of the lands where we live, learn and work.

City Road, London

Ecocity, Kuala Lumpur

TACKLIT © All Rights Reserved, 2026.

St Kilda, Melbourne

We acknowledge the Aboriginal and Torres Strait Islander peoples as the first inhabitants of this nation and the traditional custodians of the lands where we live, learn and work.

City Road, London

Ecocity, Kuala Lumpur

TACKLIT © All Rights Reserved, 2026.

St Kilda, Melbourne

We acknowledge the Aboriginal and Torres Strait Islander peoples as the first inhabitants of this nation and the traditional custodians of the lands where we live, learn and work.

City Road, London

Ecocity, Kuala Lumpur

TACKLIT © All Rights Reserved, 2026.

St Kilda, Melbourne

We acknowledge the Aboriginal and Torres Strait Islander peoples as the first inhabitants of this nation and the traditional custodians of the lands where we live, learn and work.

City Road, London

Ecocity, Kuala Lumpur

TACKLIT © All Rights Reserved, 2026.